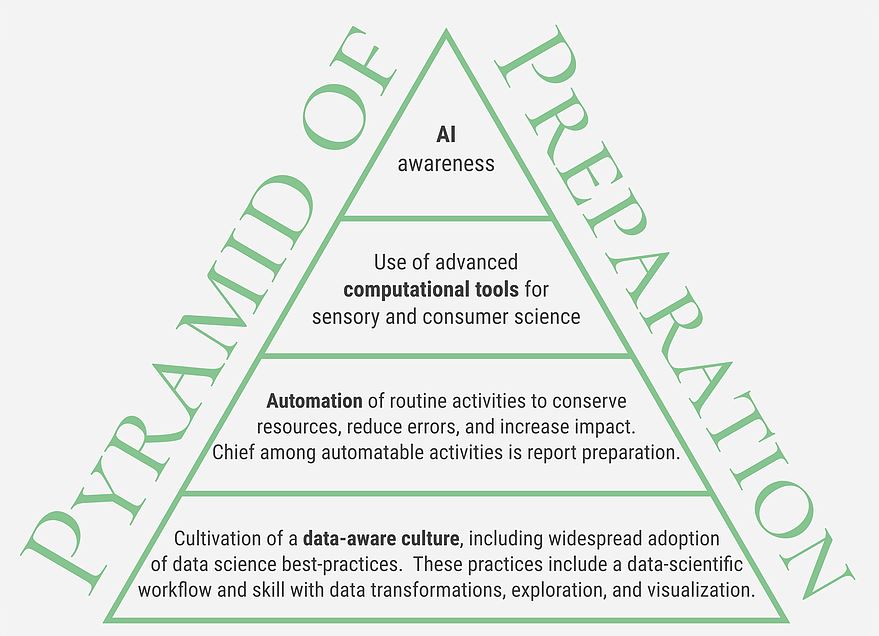
Once a data-aware culture is in place, and we’ve automated standard processes such as report preparation, it’s time to consider what analyses are now available thanks to advances in algorithmic and computing power. The goal of today’s post is to overview what I see as five key computational advances that are now open to sensory and consumer scientists – each advance merits a blog post of its own to provide additional details. What I intend to do today is to list the opportunities, discuss the sorts of questions we can now answer, and provide some resources for those interested in learning more on their own.

Advance 1: More meaningful statistical approaches, especially Bayesian approaches
A long-standing issue for me has been the relative meaninglessness of p-values within sensory difference testing – if a product or process is changed, we know the new samples are different from the old sample, so what’s the point of testing against a null hypothesis of “no difference?” At the Institute for Perception, this was a difficulty we addressed by comparing sensory effect sizes, as estimated by the Thurstonian d’, to a pre-established consumer-relevant action standard. For this reason, I believe precision of measurement is more important than power when it comes to analyzing sensory difference testing data. Specifically, I believe we can make progress by estimating a consumer-relevant action standard using a Thurstonian model for the same-different test, and then computing a probability statement to reflect our confidence that the difference between a new sample and an original sample is not consumer relevant (see here for a technical report summarizing results on this topic I presented at SSP last year). Even so, a Bayesian solution to this problem is ultimately the correctly specified solution – using Bayesian statistics, we can fully quantify our beliefs about the difference between the samples we test, both before and after the experiment. Moreover, we can use our quantified beliefs to answer such questions as, “How sure are we that consumers won’t describe these samples as different?” and “What will the costs likely be to us if we are wrong in our decision?”. Bayesian statistics comprise a broad topic, but I’m working on a paper entitled, “A Bayesian Framework for Consumer-Relevant Difference Testing,” and I’ll be sharing more about this topic here on this blog as well, so stay tuned. In the meantime, I highly recommend the book “Statistical Rethinking” by Richard McElreath.

Advance 2: More appropriate statistical analyses, especially bootstrapping and permutation tests
Just as p-values were embraced historically within the statistics community because Bayesian statistics were too computationally intensive to implement, distributional assumptions have proliferated as non-distributional approaches such as bootstrapping and permutation tests were also too computationally intensive to be practical. We can see these assumptions in the widespread use of normal distributions and t-tests, for example. As with Bayesian analyses, non-distributional approaches are experiencing a renaissance as improved computing and algorithmic power have enabled their everyday use. Just this past winter, at the Conference on Statistical Practice, I attended a workshop on “Bootstrap Methods and Permutation Tests” taught by Tim Hesterberg of Google, and he opened my eyes to just how much information we can extract from a dataset using resampling methods. The benefit of these methods is that we don’t need to make assumptions about the underlying shape of the data – we allow ourselves to be informed only by the data that were collected.
Using these approaches, we are in a better position to analyze data such as those collected in CATA protocols or time-intensity evaluations. In this case, the question we answer is, “What can we learn from this experiment, knowing only the data that were collected?” Given the struggles I’ve experienced at times trying to determine the underlying distribution of a dataset so that I could choose an appropriate statistical analysis, this non-distributional approach is welcome. For learning more about bootstrap and resampling methods, I recommend the resources listed by Dr. Hesterberg, especially his article “What Teachers Should Know About the Bootstrap.”

Advance 3: Graph-theoretic search
This advance is one I’ve been promoting since at least 2010 when I taught a workshop on the topic in Rotterdam before Sensometrics. It was also an essential aspect of my collaborations with Michael Nestrud as he completed his Ph.D. under Harry Lawless at Cornell (here and here), and of the topic of the workshop I organized at the 2011 Pangborn meeting in Toronto. In short, if we know something about the relationships between items – such as ingredients, flavors, packaging components, branding elements, to name just a few possibilities – we can create a graph that represents the network of our knowledge. Because of the algorithmic advances in graph theory (and to a lesser extent computing power), we can then study these graphs to gain insights as to which combinations of items are likely to be successful or are likely to be unsuccessful. Since the space of possibilities is astronomical (as I’ve noted in the past, in some applications, there are more possibilities than there are grains of sand on all the beaches in the world), these graph theoretic search techniques can be invaluable for suggesting options that are perhaps obvious in retrospect but would never have been discovered otherwise. Hence the question here is, “What combinations should we consider that we might otherwise be overlooking?”
For a rigorous grounding in graph theory, I would recommend Bondy and Murty’s “Graph Theory.” However, if you want to jump in, the igraph package in R is a good place to start. And, finally, it should be noted that graph theory and Bayesian analysis combine to investigate causality in “Bayesian networks.” For this more sophisticated topic, I’ve used “Bayesian Networks: With Examples in R” by Scutari and Denis and would recommend it.

Advance 4: Functional optimization
Optimization problems comprise a large subgroup of the difficulties we typically face in sensory. In fact, one might wonder whether all challenges in life are ultimately optimization problems, but we’ll restrict ourselves here to situations where the explicit goal is the maximization or minimum of a measured quantity such as purchase interest. Historical efforts within sensory to optimize single quantities have often relied on straightforward techniques such as regression or matrix decomposition, for which there are exact solutions, but more sophisticated techniques require maximizing a function of many variables. Moreover, as is the case with TURF analysis, for example, there might be several measures of interest and the “best” solution requires finding desirable (or at least acceptable) values for all of the measures of interest. Finally, the function we’re optimizing might not behave predictably – small changes in the inputs could lead to substantial changes in the outputs. In total, there are three ways that optimization might be complicated:
1) A vast search space
2) Several outcomes that must be simultaneously optimized
3) A poorly behaved function
Graph-based searches can solve some of the first complications. As we’ll see in Advance 5, statistical learning approaches can also help solve these complications. One other important technique that helps with a vast search space is linear programming – any time we can describe a goal as a linear function of even a large number of inputs, where we can also specify the constraints on those inputs in linear terms, we can solve enormous problems using linear programming. For one such example, Daniel Serra showed that TURF is a solved problem for the problem sizes we encounter in sensory and consumer science. Will Russ and I have extended this work considerably to allow for statistical testing together with high levels of customization to the found solutions – I’ll have a poster on this topic at Pangborn 2019 if you’re interested in learning more. In the meantime, I recommend “Linear Programming: An Introduction With Applications” by Alan Sultan.
For the second type of complication, multi-objective optimization is now a well-studied problem. For the third complication, evolutionary algorithms (among other advanced optimization techniques) can be helpful. As functional optimization is a massive topic, I’m going to save further discussion for future posts, but for now, please be aware that any problem you can specify as an optimization problem can probably be approached using modern techniques. In short, whenever you ask yourself, “How do we make (purchase interest, click through rate, sustained gaze, reaction time, emotional reaction, and so on) as big (or small) as possible?”, realize that you’re dealing with an optimization problem and that excellent tools may exist to help you.
For further reading on this topic, I recommend “Modern Optimization with R” by Paulo Cortez. I also recommend the Great Course “Mathematical Decision Making: Predictive Models and Optimization” for a pleasant overview of this topic.

Advance 5: Machine learning
We’re now at the last advance of our list, which is the hot topic of machine learning. Note that, for what follows, I’m going to discuss what might also be called statistical learning, and I won’t be discussing machine learning techniques that require extensive training datasets such as deep neural networks. For the sensory and consumer scientist, what we are more likely to face are situations where we have datasets of small to medium size (at most 1,000 records and typically many fewer) and either have known categories – such as those determined by usage information – or have classes that we’ve derived – such as sensory segments. Our job is typically to predict category membership from measured quantities such as demographic, behavioral, or psychographic variables. To this end, statistical learning techniques such as classification trees can help find high-quality combinations of input variables (together with the interactions between those variables) to consider out of the astronomical number of possible combinations of those variables. The critical question here is, “How can we predict category membership?”. If you’re interested in this topic, my mentee Will Russ will be giving a talk “Characterizing Consumer Segmentation using Machine Learning” at the upcoming Pangborn conference – in case you can’t wait, here’s a copy of a technical report he and I authored on the topic. I also recommend “An Introduction to Statistical Learning” by James et al. for a general introduction to the topic.

Wrapping up
Okay, that’s the end of this week’s post! I hope this overview has given you some sense of what’s possible. Next week we’ll consider the last part of the Pyramid of Preparation, which is a big picture awareness of what’s going on with artificial intelligence. Be sure to sign up for our weekly blog newsletter by signing up for an Aigora blog account, and/or follow Aigora on LinkedIn, if you’d like to be notified when additional posts go live.
Source: 5 Computational Advances that are Helping Sensory and Consumer Scientists Answer New Questions